Summer SAVY, Session 5 Day 2, Wildlife Ecology (5th -6th)
Day 2 of Wildlife Ecology started with a 4-corners getting-to-know-you activity. We reviewed the classroom expectations and asked for someone to summarize what we learned yesterday. To see if we remembered some of yesterday’s material, they took a “pop” quiz, just 5 questions multiple choice. We then completed the reasoning wheel activity which led to a discussion of the difference between an assumption and an inference. Ask your child if they can remember the difference. Next, we talked about different kinds of models – physical, conceptual, and mathematical – and they identified ten examples. Most were clear cut but an image of the formula for photosynthesis that included the sun led to a debate on whether it was conceptual or mathematical. We concluded that it is a combination of the two. Before breaking for lunch, we talked about maps as models using the well-known John Snow map of the London cholera outbreak of 1854. If you are not familiar with it, ask your child, it’s an amazing story.
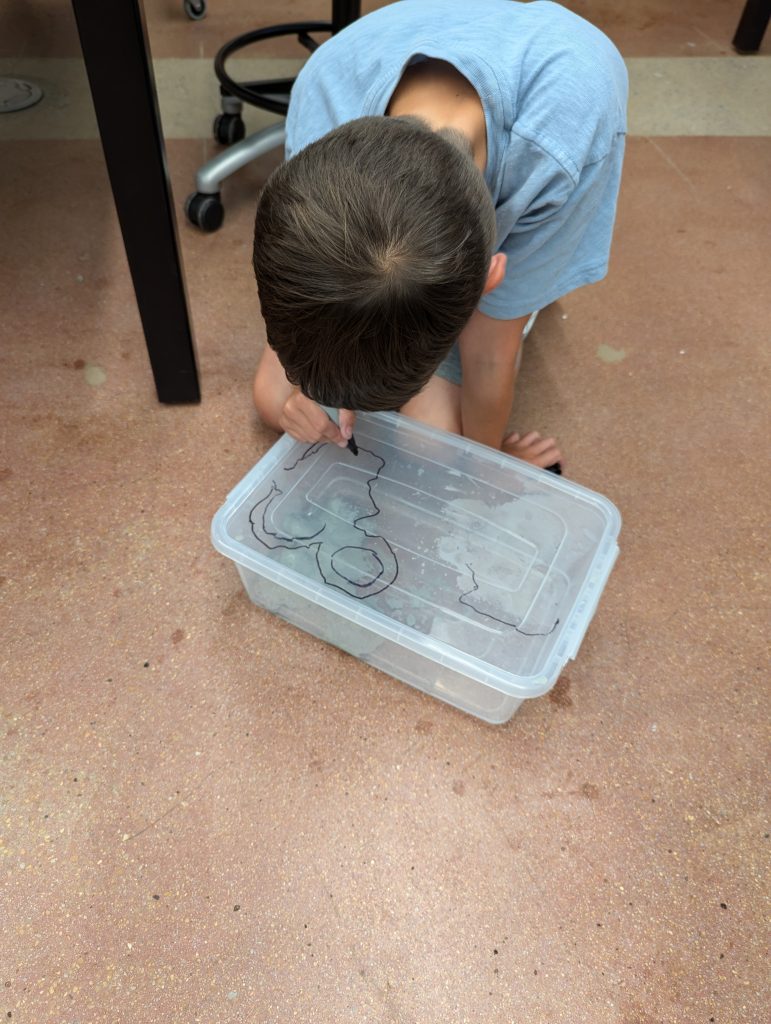
After lunch, we looked at satellite images (maps) of Nashville. The students were asked what kinds of information they could get from the maps. A specific question was could they tell which way the Cumberland River was flowing? They of course know that water flows downhill but a basic map doesn’t show elevation. I gave them the cheat of looking at Old Hickory Lake. Could they locate the dam? Does this give them clues about the direction of flow? We then looked at topographic maps to see how such a map shows elevation and how you can distinguish areas that are relatively steep from areas that are less so. I pulled up a topo map of Mount Le Conte in the Smokies and using the contour lines they were able to estimate the height of the mountain. It was then time for the map-making activity. This involved creating a landform with modeling clay in a clear plastic bin and then creating a topo map of the landform. Here is a picture of one of the students creating the map.
Ask your child how the map was created if it’s not clear in the picture. They had a lot of fun with this activity and got very creative. They wanted to have volcanoes on their landform, so I used the remaining time to talk about volcanoes and show them maps and images of the Galapagos Islands with a focus on the calderas on the tops of these volcanoes. They are of course very drawn to the drama of an erupting volcano, but I attempted to point out that the biology is very interesting after the volcano is inactive. Have a good evening and feel free to ask your child about their day. What did they learn about models and maps? How did the work of John Snow save lives?
