It is hard to believe the week is already over, but we tackled a couple of fun projects today that I hope left the kids wanting to learn more!
As we have done the past few days, we began our morning with an observation of the Sun using a current image from the orbiting Solar Dynamics Observatory (SDO). and students made their last recordings (drawings) of the sunspot locations on the solar disk. They then carefully measured the apparent latitude of the largest sunspot over successive days to determine how many degrees it appeared to move each day, and we reached a final result by averaging the class values. After compensating for the movement of Earth and its orbit during this time, the class achieved a final value very close to the expected value of the Sun’s rotation – about 25 days when viewed at the equator. This also led to a discussion of how different parts of the Sun rotate at different rates due to it being a very large ball of gas instead of a solid, and how other stars show signs of sunspots, some of which can cover a significant portion of their surfaces.
Our final task at the observatory was to create a crude photometer, a device that would measure the amount of light falling on it. To do this, students made use of the Arduino microcontrollers, which they programmed yesterday, and connected them to a photoresistor, a small device that changes electrical resistance depending on the amount of light falling on it. Once calibrated, we darkened the library and simulated a star on the projector screen. As the microcontrollers detected the amount of light in the room, the data they recorded was plotted on the students’ computer screens. With the disk of the star by itself, the graph’s light intensity was reading 100% as time passed. As an imaginary planet passed in front of the simulated star, it appeared as a dark disk that blocked a certain portion of the star’s light. The students saw this “transit” as a dip in the graph on their screen. We demonstrated how a planet that is half the diameter of the star blocks one-fourth of the star’s light (since the surface area of a circle that is half the size of another circle has one-fourth the surface area), which was reflected in the graph showing a 25% decrease in light intensity. As we increased the size of the planet to about 70% of the diameter of the star, the planet was able to block out half the star’s light, which resulted in a dip of 50% in the plot of data. These simulated planets were much larger than what planets typically are compared to their parent stars, so we tried the same experiment with a Jupiter-sized planet, which is only 10% the diameter of the Sun. The photometers were able to detect a small dip in the light; however, when we brought the planet’s size down to 1% of the diameter of the star, which would be comparable to Earth next to the Sun, many photometers were unable to detect the dip due to the extremely small decrease in light. This led to a great discussion about how difficult it is for astronomers to detect planets like Earth orbiting around other stars. SIDE NOTE: If your student really enjoyed the electronics/programming aspect of some of these projects and you have questions about doing a project, please email me and I can either provide some input or point you to a resource>
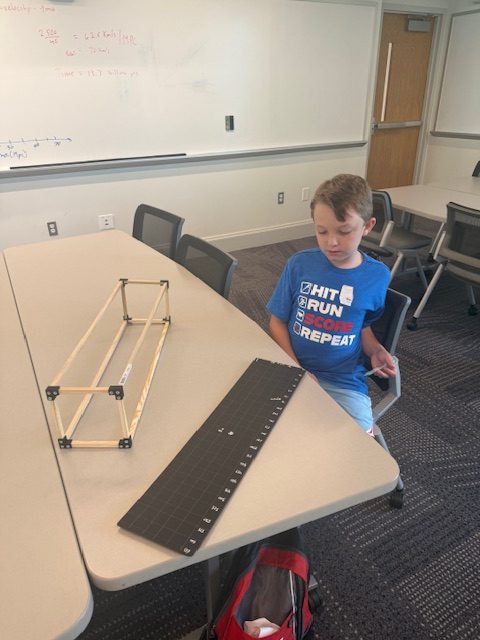
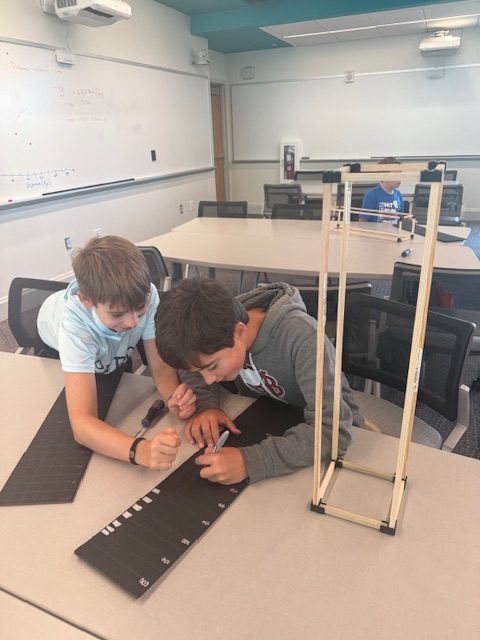
Once back on campus, the last project for the week was to construct a model of the Orion constellation. Students assembled rectangular prisms out of wood dowels and 3-D-printed corner pieces to create a space in which to hang beads that represented the seven bright stars of Orion. The top and bottom of the model were constructed from foam board, and on the top piece, we overlaid a grid to represent distance in X-Y coordinates. As a class, we went through plotting the coordinates of the stars on the foam board. The result was basically a top-down view of the Orion constellation, a view that we cannot see from Earth. The final step was to run the string through the beads, not them in place, and then suspend them within the model at the right height. Unfortunately, we ran out of time, and students were only able to hang one star – the bright supergiant Betelgeuse. But, having done one store as an example, they should be able to finish the model with the beads and string that were sent home with them. Once completed, they can view the constellation as it appears in the sky by placing their eye a couple of inches in front of the model. The coordinates for the stars are given in the attached figure.
It has been a fun week, and I have had a lot of fun working with these bright students. I would also like to give a big shout-out to our CAs, Ms. Andrea and Ms. SiQi, who have been a huge help in the classroom and in helping me to navigate SAVY. I am hopeful we will see all of our students at Dyer Observatory during some of our public nights with their family and friends, especially the monthly Telescope Nights, so they can view through our telescopes and see all of the exhibits. Please check out our website and feel free to contact us if you have any questions! Have a great rest of the summer!
Questions:
- How did the size of a planet affect the shape of the light curve your Arduino was plotting on the computer? Did anything happen if the planet didn’t go straight through the center of the star?
- If you used a sunspot near the equator of the Sun to measure the Sun’s rotation versus a spot near its poles, would you get different values for how long it takes the Sun to rotate? Why?
- Did you enjoy working on the model of Orion? What part did you find most enjoyable (e.g., working with your hands to build the frame, plotting the positions of the stars, actually getting to hang the stars in the model)?