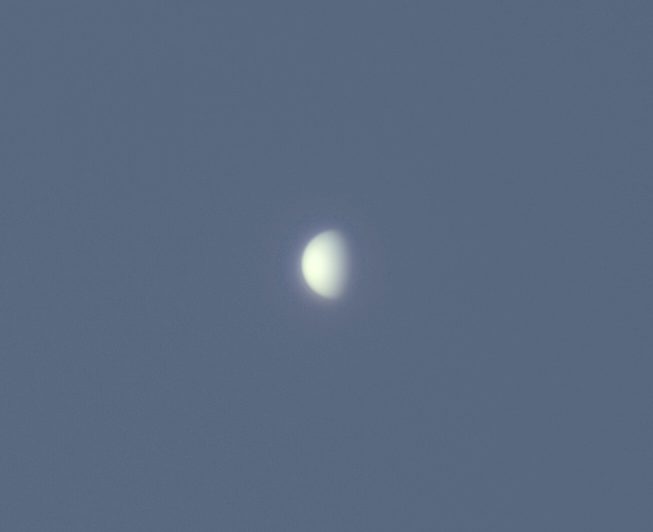
Our students began the day at Dyer Observatory’s Seyfert Telescope. Clear skies allowed us some very clear, broad-daylight views of two prominent stars (Sirius and Betelgeuse), which are normally only visible at night. Our last view was that of our sister planet, Venus, which currently exhibits a gibbous phase. We discussed with the students how both Mercury and Venus show a complete set of phases as they orbit, thanks to their orbits being closer to the Sun.
We spent the remainder of the morning working with Arduino Uno microcontrollers and electronic components such as resistors, LEDs, breadboards, servos, and potentiometers. We went through how to connect an LED and program the Uno to make the LED flash. Students also tried their hands at modifying the coding a bit to change the rate at which the LEDs flashed. We went on to make a more complicated setup that utilized a potentiometer (a resistor whose resistance value changes as you turn the knob) to control the position of a small servo motor. On Friday, we will build a final circuit that makes use of a photoresistor, a resistor that changes resistance as the intensity of light falling on it changes, to create a photometer that will replicate how astronomers can detect unseen planets orbiting other stars. Throughout the week, as students have visited Dyer, they have encountered several exhibits and even components of the observatory that run off of these very versatile microcontrollers. It is also my hope that students will be inspired by their own ideas for Uno projects at home (Dr. Billy, for example, uses them for Halloween decorations).
Once back on the Peabody campus, class resumed with guest speaker Dr. Marcelo Disconzi, a professor of mathematics at Vanderbilt who deals with fluid dynamics, gravity, relativity, etc. He spoke to the students about how astronomers figured out that the universe is expanding and ultimately came about as a result of the Big Bang. To bring the point home, he engaged the students in an activity involving balloons, stickers, markers, and rulers. Students first inflated the balloons a small amount while placing on them small stickers and drawing waves with markers to represent light waves. After measuring the size of the waves with rulers, students inflated the balloons to a much larger size, which represented the expansion of space in the universe. In doing so, the space between the stickers (which represented galaxies) increased significantly, showing how all galaxies appear to be moving away from one another, an observation that was made by Edwin Hubble about a century ago. In addition, additional measurements of the light waves showed they were stretched, which would indicate the light waves are also reddening – another observation we have made about the universe. It’s fascinating how such a simple demonstration can easily replicate what astronomers actually observe. Dr. Disconzi ended by passing out copies of a book he is the author of: Who Me? I’m a Mathematician Now. The book, which is one of about a dozen in the Who Me? series, features scientists around Vanderbilt who write about what they were thinking and doing when they were the age of our students, providing real-life examples of how people who were thinking the same things as our students went on to do great things in prominent careers.
To end the day, students undertook an activity that emphasized the focus of Dr. Disconzi’s talk. Using real astronomical data on a University of Washington interactive website, students paired up to make measurements of the sizes and spectra of a dozen galaxies. By using a spreadsheet, they were able to take the apparent sizes and convert the values to corresponding galactic distances. With the spectra, they could measure the apparent shift of spectral features (redshift), plug the values into the spreadsheet, and calculate the velocities of the galaxies. As they achieved these values, the class as a whole plotted their values of velocity versus distance on the whiteboard. When all values were in, we were able to fit the data with a trendline whose slope yielded the expansion rate of the universe. The students did really well – the final value was very close to the accepted value. In the last minutes, we discussed how knowing this “Hubble Constant” can tell us how long ago the Big Bang occurred: by knowing the distance of a galaxy and how fast it is moving, one can calculate how long it took to get to that position, which ends up providing us with an age of the universe.
Questions:
- How does Venus’ position around the Sun in relation to Earth give us phases? When would we see it as a thin crescent or in a full phase– when it is really near us or on the opposite side of the Sun
- Were you surprised by how well you could see the stars in the telescope during the daytime? What did they look like?
- Do you have any ideas of projects you might want to do in which you could use an Arduino? Note that you can do a quick search online, and there are countless resources for ideas that make use of the Uno or other versions of Arduino.